Topics:
Back to homepage,
wavelet transform,
discrete wavelet transform,
continuous wavelet transform,
wavelet denoising,
wavelet compression
Wavelet denoising
Discrete wavelet transform can be used
for easy and fast denoising of a noisy signal. If we take
only a limited number of highest coefficients of the discrete wavelet
transform spectrum, and we perform an inverse transform (with the same wavelet
basis) we can obtain more or less denoised signal. There are several ways
how to choose the coefficients that will be keeped. Here, only two most simple
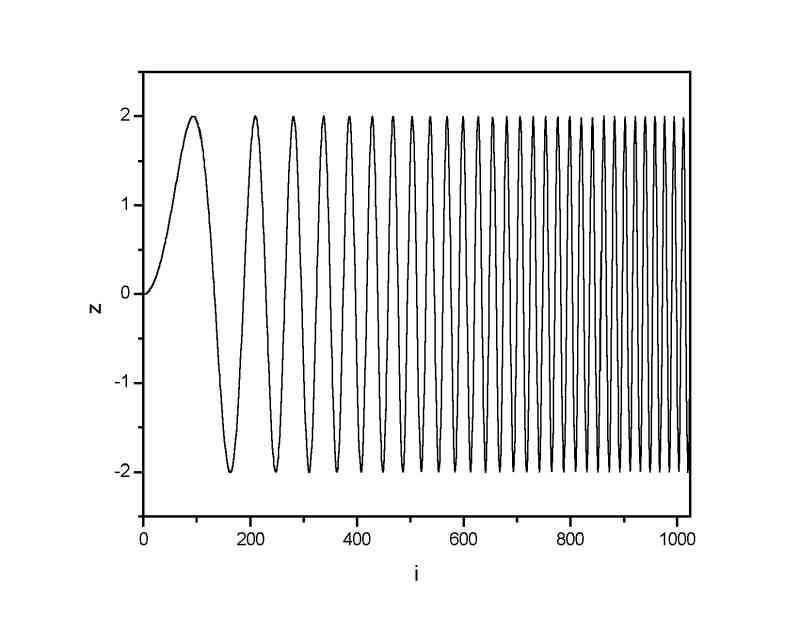
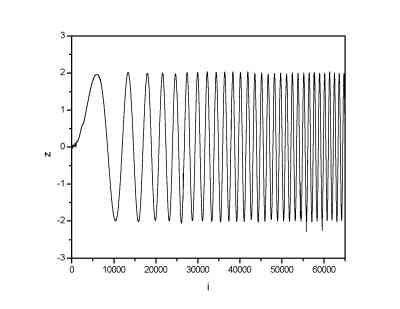
methods were tried - hard and soft tresholding. In the Fig. 1 one can see
a simple signal (sine with a lineary increasing frequency) that was used for
most of the demonstrations. In the next examples, a noise was added to this
signal and the denoising procedure ws used. For this denoising, approximately
4 % of the wavelet coefficients were used for the reconstruction of the original signal.
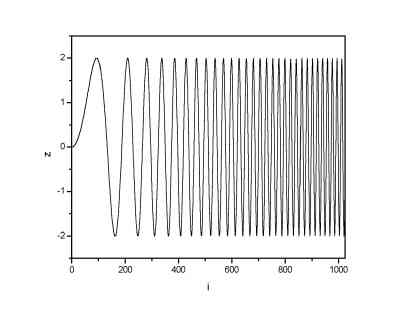
Original signal
Example 1
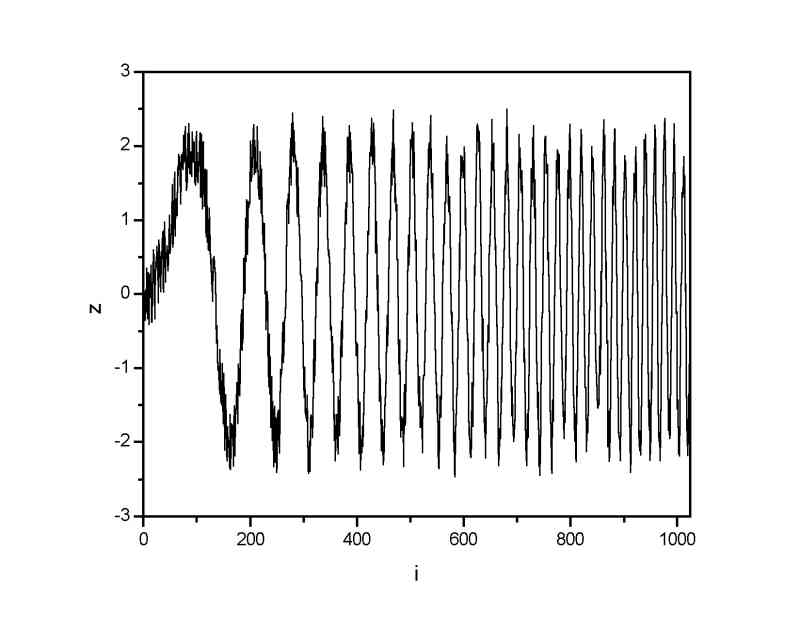
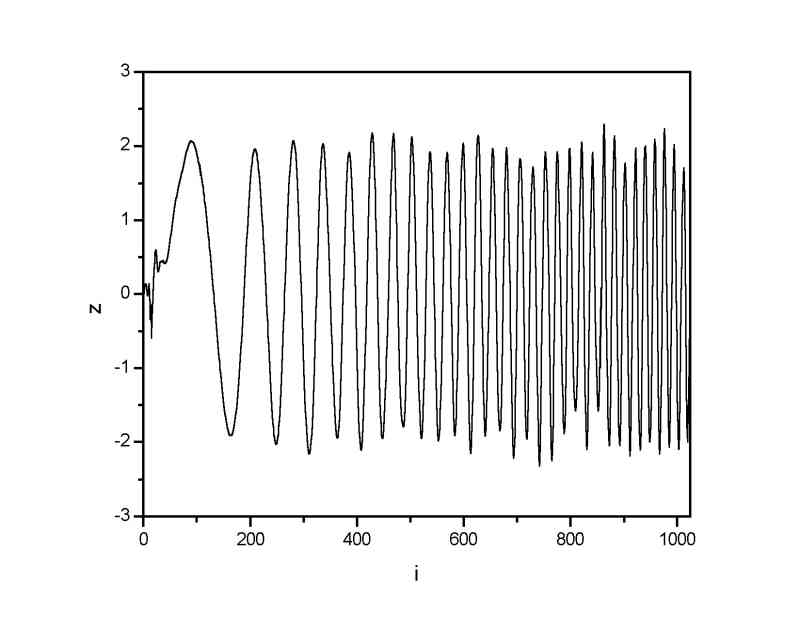
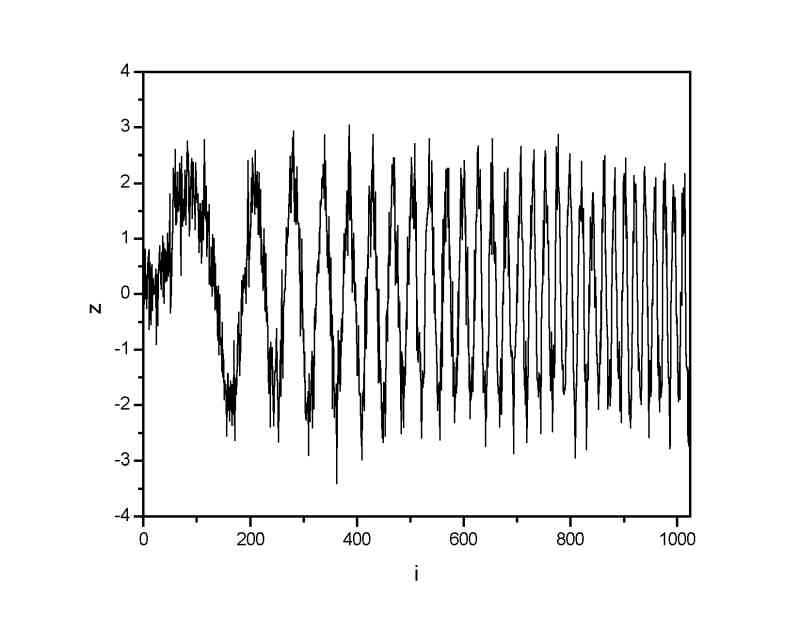
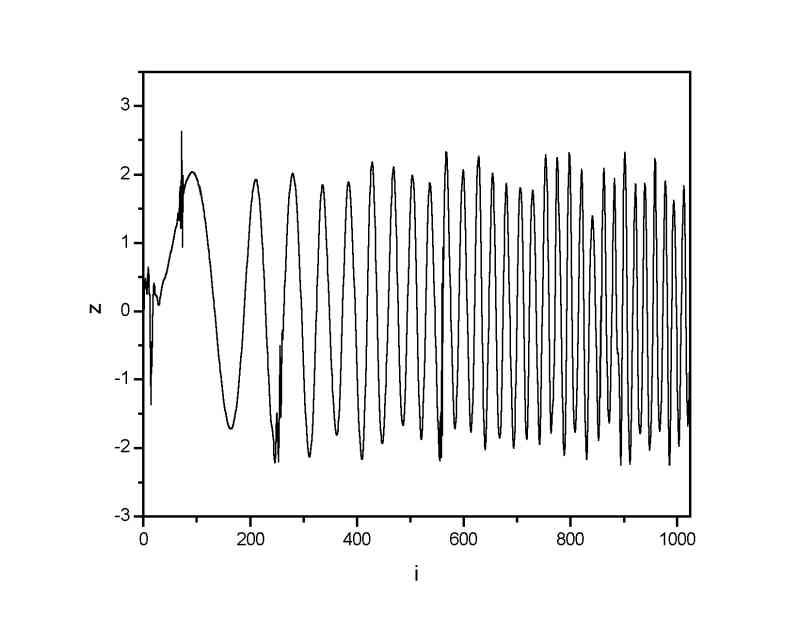
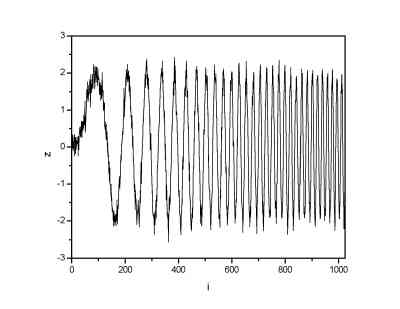
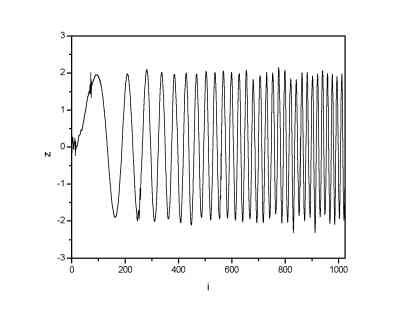
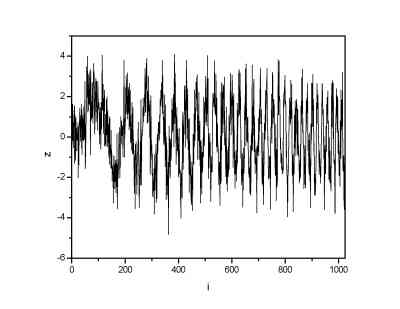
The uniform noise was added to the 1024 points long signal.
 |
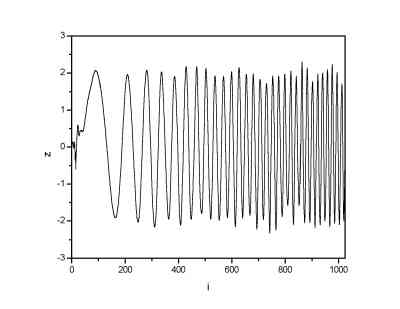 |
| Signal with uniform noise (noise range (-0.5; 0.5)) | Signal denoised by means of DWT |
Example 2
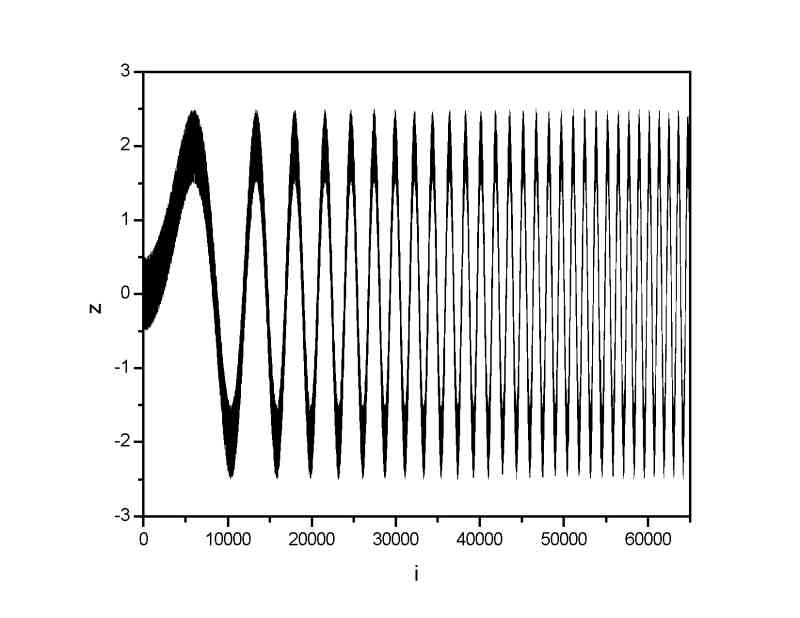
The uniform noise was added to the 65536 points long signal.
 |
 |
| Signal with uniform noise (noise range (-0.5; 0.5)) | Signal denoised by means of DWT |
Example 3
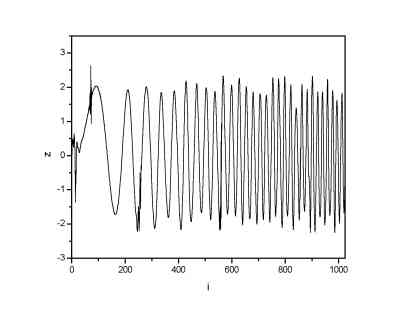
Gaussian noise with sigma=0.2 was added to the 1024 points long signal.
 |
 |
| Signal with gaussian noise (sigma=0.2) | Signal denoised by means of DWT |
Example 4
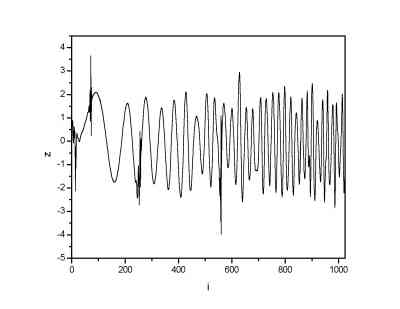
Gaussian noise with sigma=0.5 was added to the 1024 points long signal.
 |
 |
| Signal with gaussian noise (sigma=0.5) | Signal denoised by means of DWT |
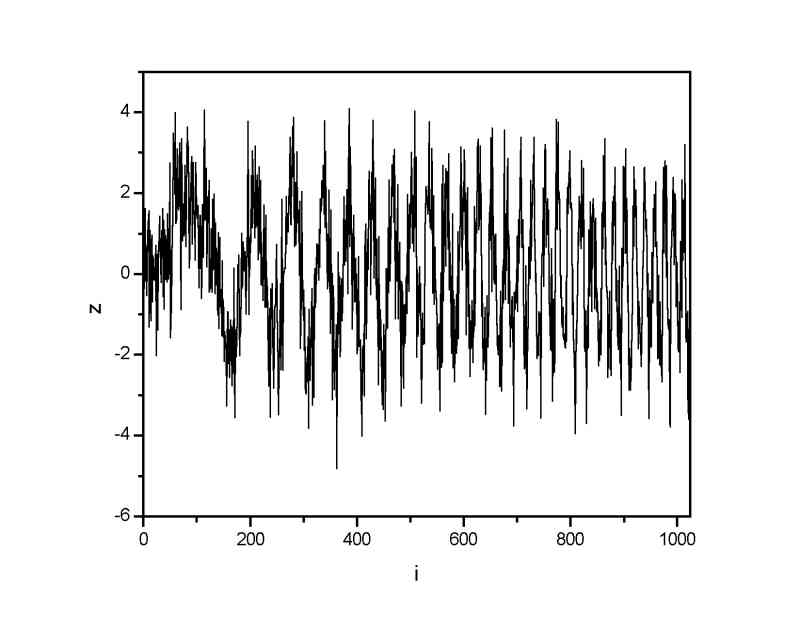
Example 5
Gaussian noise with sigma=1 was added to the 1024 points long signal.
 |
 |
| Signal with gaussian noise (sigma=1) | Signal denoised by means of DWT |
Wavelet type influence
As it is known from the theory of discrete wavelet transform, the choice of the
proper wavelet scaling function is allways the most important thing. Generally, for the denoising
the wavelet scaling function should have properties similar to the original signal (continuity, continuity
in derivatives etc.). Here, the effects of using
two different wavelets were compared. We used the Daubechies 8 and Daubechies 20 wavelet. Note that
for both the wavelets the denoising procedure resulted in quite satisfying result. If we use for example
Haar wavelet (box scaling function) for our signal constructed from sine functions, the result would be very
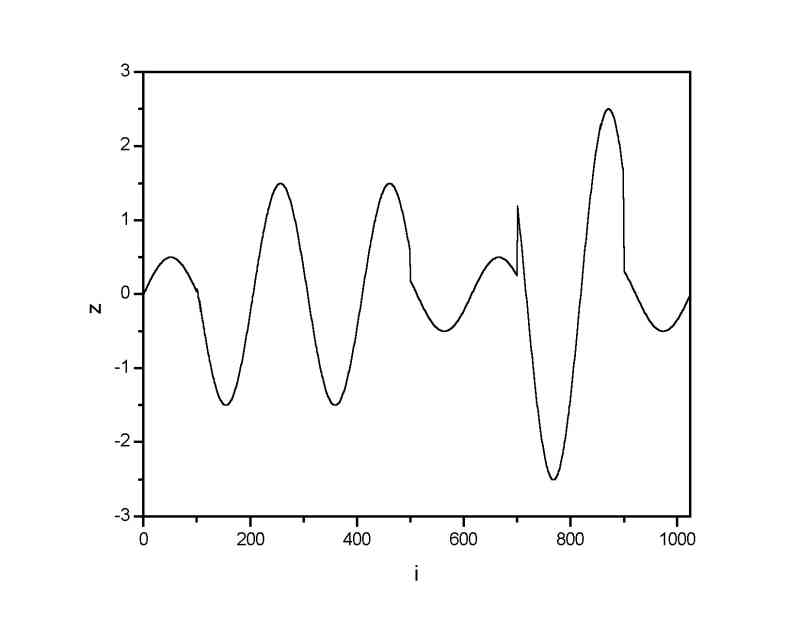
poor. As a signal we used a sine function which was in some parts of the signal multiplied by a constant.
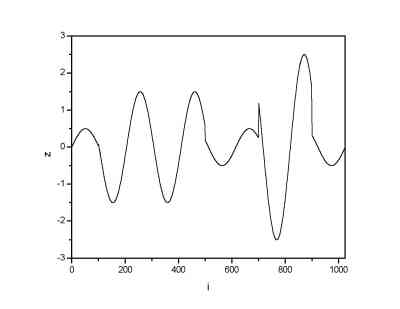
Original signal
We than added a gaussian noise to this function by a similar way as in previous examples.
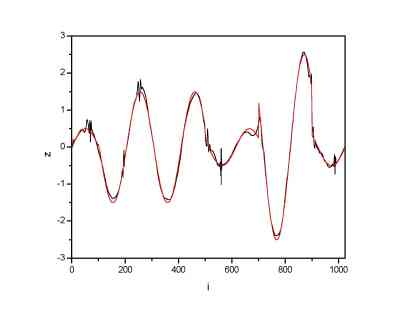
Example 6
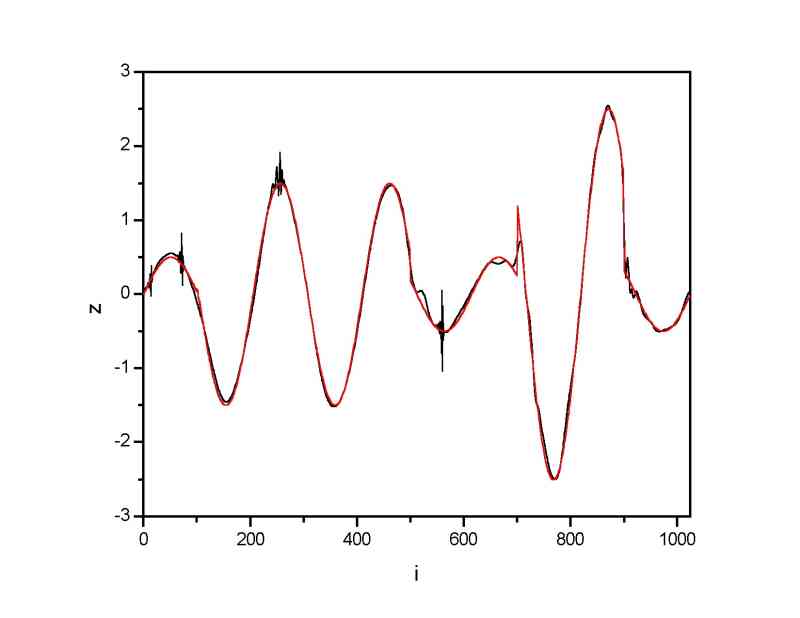
Here denoised signals are plotted for two basis wavelets. The original signal is plotted as well (red line).
 |
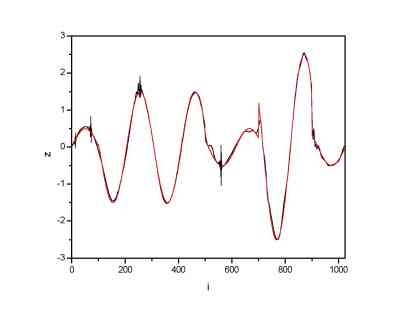 |
| Denoising using Daubechies 8 scaling function | Denoising using Daubechies 20 scaling function |
We can see that in both cases signal was reconstructed in a satisfactory way. The comparison between the difference
between the signals and the original one is given below.
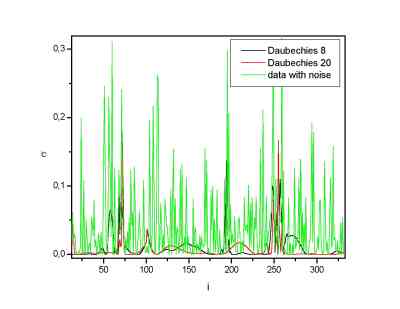
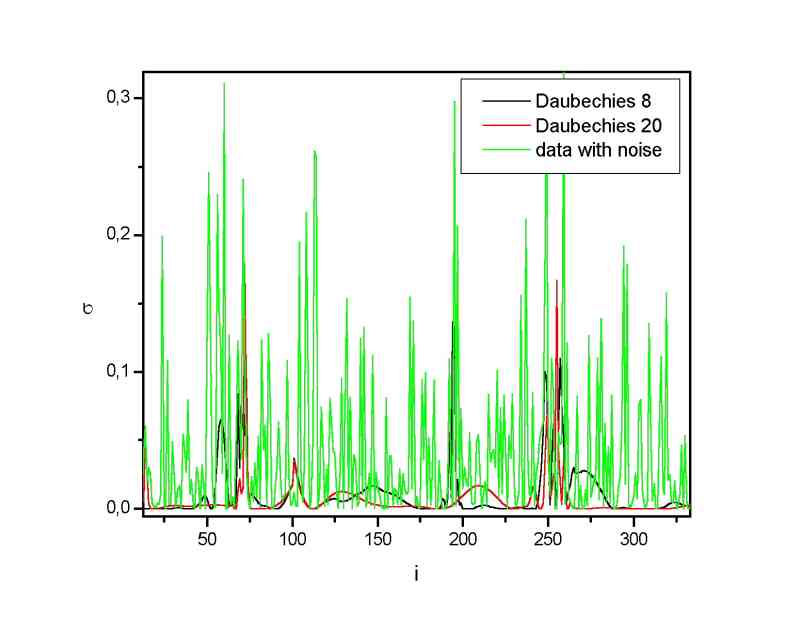
Square deviation of the noisy and denoised signals with a respect to the original one: the yellow lines
give the noisy results, e.g. the noise. The other two lines are the denoised signals. Only part of whole signal is plotted
to see the differences better. the big suppression of the noise in the denoised data is seen. The Daubechies 20 wavelet scaling
function gives better results here. Also the standard deviation of the denoised signal with a respect to the original one is for this
(Daubechies 20) wavelet approximately 30 % lower than for the Daubechies 8 wavelet.
Real data examples
Created by Petr Klapetek, February 2002